

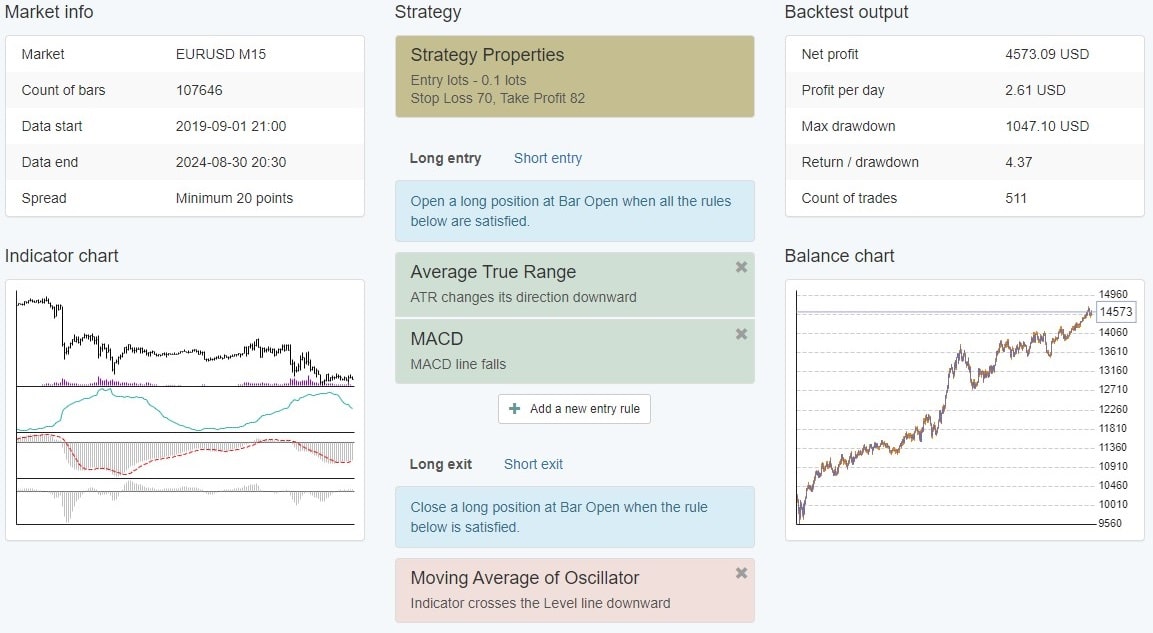
A trend following EA is an expert advisor that opens and manages positions in the direction of an established market move, rather than trying to catch reversals. The system described here trades EUR/USD on the M15 chart, combining MACD, OsMA and ATR signals with a fixed 0.10-lot position size, a 70-pip stop loss and an 82-pip take profit.
Those settings are published. Absent from the source is any performance record: no backtest, no live results, no trade count. This page explains what the robot does and what you would need to establish before trusting it with money.
Updated for 2026. Parameters below are unchanged from the original strategy description. Two ambiguities in the published logic have been identified and flagged rather than smoothed over, and the profitability language of the earlier version has been removed.
Configuration at a glance
| Setting | Value |
| Instrument | EUR/USD |
| Timeframe | M15 |
| Position size | 0.10 lots, fixed |
| Stop loss | 70 pips |
| Take profit | 82 pips |
| Nominal reward to risk | Approximately 1.17:1 |
| Breakeven win rate before costs | Approximately 46% |
| ATR | Period 25, level 0.0045 |
| MACD | Fast EMA 17, slow EMA 44, signal SMA 9 |
| OsMA | Fast EMA 19, slow EMA 44, signal SMA 6, level 0.0013 |
| Exit | Stop loss or take profit only |
| Additional controls | Maximum spread, position count limit, total lot limit |
| Maximum daily loss | Not implemented |
| Published performance data | None |
What trend following means in an automated system
Trend followers accept being late. That is the defining trade-off, and it separates these systems from breakout or mean-reversion approaches.
A trend following robot waits for confirmation that a move is underway before committing, which means it never buys the low or sells the high. In exchange, it avoids the repeated false starts that catch systems trying to anticipate turns. The cost shows up as a lower win rate offset by larger average winners, at least in theory.

Automating that logic changes what matters. A discretionary trend trader can look at a chart and judge whether a move has genuine strength behind it. An expert advisor cannot, so it needs numerical proxies: a momentum crossover to establish direction, a second oscillator to confirm conviction, and often a volatility reading to avoid trading when conditions are unsuitable. That is exactly the three-part structure this EA uses.
Worth being clear about the category’s reputation. Trend following works well in extended directional moves and poorly in ranges, and no indicator combination has ever solved that. Anyone evaluating a robot in this family should be asking how it behaves during sideways conditions, not whether it catches trends.

How the entry sequence fires
Three conditions have to align before a position opens, and the order matters for understanding what the robot is waiting for.
MACD supplies the directional trigger. Its line crossing the signal establishes which way the system will trade, and nothing happens without it. OsMA then acts as a gate: momentum must have reached the defined threshold, which prevents entries on crossovers that occur while the two moving averages are barely separating. Volatility is checked last, permitting or blocking the trade depending on conditions.
That sequencing has a consequence worth noting. Because confirmation is layered, signals are rarer than a bare crossover system would produce, and each rejected setup is invisible in the trade record. A quiet week might mean no crossovers occurred, or it might mean several occurred and were filtered out. The distinction matters when you are trying to work out whether the robot is functioning.

Nothing in the published description covers what happens when a fresh signal appears while a position is already open. Position count and total lot caps exist, so presumably additional entries are permitted up to those limits, but the interaction is unspecified.
How the three indicators are configured
Each indicator does a different job, and the settings tell you something about the designer’s intent.
MACD (17, 44, 9) generates the directional signal. Those periods run slower than the conventional 12, 26, 9, reducing signal frequency and filtering some noise at this timeframe. Fewer trades, later entries, less whipsaw.
OsMA (19, 44, 6, level 0.0013) confirms momentum. OsMA measures the distance between the MACD line and its signal, so it captures how quickly that gap is widening. Adding a level threshold means a crossover alone is insufficient; momentum has to reach a defined strength.
ATR (period 25, level 0.0045) measures volatility. J. Welles Wilder introduced Average True Range in New Concepts in Technical Trading Systems (1978) as a way of quantifying price range including gaps.
Our guide to trend following indicators in MetaTrader covers how these three behave individually.
Where the published logic runs out
Two conditions are stated without the detail needed to reproduce them. This matters, because any rule you cannot state precisely is also one you cannot test.
The ATR condition has no stated direction. The source says volatility must be “within acceptable levels” and gives a level of 0.0045. Which side of that threshold permits a trade is never specified. Four readings are possible:
- Trades permitted above 0.0045, requiring minimum volatility for a move to develop
- Only quiet conditions qualify, with readings below that figure
- An upward cross through the level opens the window
- A downward cross does the same
Each produces a materially different system. The first captures breakouts into expanding volatility; the second targets quiet conditions and would suit mean-reversion logic far better than a trend follower. Check your build’s inputs before assuming either.
The OsMA threshold is symmetrical in an unlikely way. For longs, OsMA must sit above 0.0013. For shorts, the source says it must remain below the same positive 0.0013. Taken literally, a short could trigger while OsMA is still positive at 0.0012, which would mean confirming bearish momentum with a bullish reading.
The likelier intent is a threshold of minus 0.0013 for shorts, mirroring the long condition. It is also possible the builder applies the level as an absolute distance from zero. I cannot resolve this from the published description, and neither can you without opening the strategy file.
A third statement contradicts the settings. The original description says ATR helps determine “the optimal placement of Stop Loss and Take Profit levels based on the current market volatility”. That cannot be right when both levels are fixed at 70 and 82 pips. Volatility-based stops move; these do not. Treat ATR as a filter on entries only, which is how the logic section describes it.
Reward to risk, and the number that actually matters
Dividing the 82-pip target by the 70-pip stop gives roughly 1.17:1. Modest, and the audit that prompted this rewrite stopped there.
The more useful figure is the breakeven win rate, which falls straight out of those same numbers. Divide the risk by the sum of both: 70 ÷ 152, or about 46%. Below that strike rate the system loses money before costs are even counted.
Add costs and the bar rises. Spread and any commission are paid on every trade regardless of outcome, so the real breakeven sits above 46%, by how much depending on your broker. On EUR/USD, typically the tightest major, the effect is small relative to a 70-pip stop. On a wider-spread instrument it would not be.
Is 46% achievable here? Frequently, yes. Systems in this family often run win rates in the 40s while remaining profitable, because their winners are larger than their losers. But this EA takes a fixed 82 pips every time, which removes exactly that advantage. It needs to win more often than a typical trend follower, while entering later than one.
That tension is the single most important thing to understand about this configuration, and no amount of indicator tuning removes it.
Fixed lots do not equal fixed risk
The original article claimed the 0.10-lot size maintains “a consistent level of risk across all trades”. That is half true and worth correcting.
Nominal risk per trade is genuinely constant: 70 pips at 0.10 lots is the same monetary amount every time. What varies is the percentage of your account that amount represents. On a $2,000 balance it is roughly 3.5%; after a drawdown to $1,500 the same trade risks nearly 4.7% of what remains.
Fixed sizing therefore increases percentage risk precisely when a balance is shrinking, and decreases it as the account grows. Percentage-based sizing does the opposite, which is why most risk frameworks prefer it. Neither approach is wrong, but the difference should be a decision rather than an accident.
What this page cannot tell you
No performance data has been published for this EA. That absence is worth stating directly, because the earlier version of this article described the strategy as reliable and profitable without anything to support either word.
To evaluate it properly you would want:
- Test period and market conditions covered
- Number of trades, which determines whether any result is meaningful
- Win rate, measurable against the 46% breakeven above
- Maximum drawdown and longest losing streak
- Spread, commission and slippage assumptions used
- Out-of-sample or walk-forward results
None of that exists here. A strategy description is not evidence of performance, and a free robot carries no obligation to provide either. Our note on why backtest results differ from live trading covers why even a published backtest would need scrutiny.
When this approach struggles
Four conditions cause difficulty for a system built this way.
Ranging markets. MACD crossovers multiply when price oscillates around a mean, and each one triggers a full 70-pip risk. Consecutive stop-outs in a range are the characteristic failure mode of trend following, and the OsMA threshold reduces rather than eliminates them.
Sharp reversals. Waiting for confirmation means entering after part of the move has already happened. When a trend ends abruptly, the last signal is often the worst one.
Fixed targets in volatile conditions. An 82-pip target that suits normal EUR/USD ranges will close far too early during a strong directional week, capping exactly the outsized winners the strategy depends on.
Spread expansion. That entry filter blocks trades whenever pricing widens, which protects execution while also causing missed signals around news and session transitions. A reasonable exchange, though it leaves gaps in the record that resemble inactivity.
Risk controls that are present, and one that is not
The EA includes three protections: a maximum spread threshold for entry, a cap on simultaneous open positions, and a total lot size limit. Together those address execution quality and overexposure.
There is no maximum daily loss limit. The original summary claimed otherwise, contradicting its own risk section. Correcting that matters, because a daily loss cap is the control that stops a bad session compounding, and this EA does not have one.
Adding one is possible through account-level tools or a separate risk manager. The appropriate threshold depends on your balance, drawdown tolerance and trading plan, and any specific percentage quoted without reference to those inputs is arbitrary.
Testing it before it touches real money
Four steps, in order.
- Confirm the ambiguous rules. Open the strategy inputs and establish the ATR direction and the OsMA short threshold. Until those are settled you do not know what you are testing.
- Backtest with realistic costs. Set spread to something matching your broker rather than the default, and use the highest modelling quality available. Our walkthrough on backtesting an EA in MT4 covers the settings that distort results when left alone.
- Validate out of sample. A single optimised period proves very little. Walk-forward analysis tests whether parameters hold up on data they were not fitted to.
- Forward test on demo. Run it live-but-unfunded long enough to see at least one losing sequence. The gap between demo and real accounts shows up mainly in fills and slippage.
Compare the result against a simpler benchmark before concluding anything. A single moving average crossover on the same pair and timeframe costs nothing to test, and it tells you whether three indicators are earning their complexity.
What good and bad results look like here.
A credible outcome for this configuration would show a strike rate comfortably above 46%, a drawdown you could sit through without intervening, and a trade count in the hundreds rather than the dozens. Consistency across separate market periods matters more than the headline return.
Warning signs are equally identifiable. A win rate hovering near the breakeven figure means costs decide the outcome, which is not a strategy so much as a coin flip with fees. A long losing streak concentrated in one period suggests the system met a range and could not cope. And results that collapse when spread assumptions rise from optimistic to realistic indicate the edge was never large enough to survive execution.
Record all of it before deciding anything, because the comparison you will want in six months is against your own earlier numbers rather than against a description written by somebody selling software.
How it differs from a breakout system
Both approaches trade in the direction of a move, and they are frequently confused.
Breakout systems enter as price clears a defined level, accepting more false signals in return for earlier entries. Trend following waits for indicator confirmation, arriving later but with fewer failed starts. This EA sits firmly in the second camp. A MACD crossover, momentum validation and a volatility check together form a confirmation stack rather than a trigger.
Our comparison of breakout expert advisors covers when each style suits different market conditions.
Frequently asked questions
Is a trend following EA the same thing as a trend following bot?
Yes, the terms describe identical software. “Expert advisor” is MetaTrader’s name for an automated strategy, while “bot” is the informal equivalent used more often around crypto platforms. Anyone searching either phrase is looking for the same thing: a program that identifies directional moves and trades them without manual input. Vocabulary aside, the evaluation questions are unchanged, namely what the entry rules are, how positions are sized, and what evidence exists that the logic works.
Does this EA run on MetaTrader 5?
The strategy described here targets MetaTrader 4, and its code will not execute on the newer platform without a rewrite in a different language version. All three indicators are standard on both platforms, so the logic itself is portable even though the compiled file is not. Anyone needing MT5 specifically would have to rebuild rather than transfer. Check which build you hold before assuming compatibility with an existing terminal, since file extensions alone will tell you: ex4 files belong to the older platform.
Can the strategy be applied to pairs other than EUR/USD?
Technically yes, though the parameters would need revalidating rather than copying across. An OsMA threshold of 0.0013 and the 0.0045 volatility figure are absolute price values, which means they carry entirely different meanings on a yen pair quoted to three decimals or on gold. A 70-pip stop also represents very different volatility exposure across instruments. Treat any transfer as a new strategy requiring its own testing programme rather than a settings change.
Would this work as a crypto trading bot?
Not without substantial rework, despite the query appearing regularly. The absolute indicator levels are calibrated to EUR/USD price ranges and would be meaningless on Bitcoin, where a single pip means something entirely different. Crypto also trades continuously rather than in sessions, changing how volatility filters behave. The underlying trend following logic transfers conceptually; the specific numbers in this configuration do not, and using them unchanged would produce unpredictable behaviour.
How many trades should this EA produce?
No trade frequency is published, which is itself informative. Slower MACD settings of 17 and 44, working alongside the momentum threshold and a volatility filter, suggest a selective system rather than an active one. Expect quiet periods between signals. That matters for evaluation, because a strategy taking few positions needs a proportionally longer test window before any result carries statistical weight. Two weeks of observation would tell you almost nothing about this configuration.
What broker conditions suit this configuration?
Tight and stable EUR/USD pricing matters most, since the spread control suspends entries whenever quotes widen beyond its threshold. A broker with frequently widening spreads will cause missed signals that look like the robot has stopped working. Execution speed matters less here than for scalping systems, given the 70-pip stop and multi-hour holding pattern. Swap charges are worth checking too, because positions can carry overnight on a 15-minute chart.
Does the EA use a fixed lot size?
Yes, 0.10 lots on every position, with no scaling and no percentage-based sizing. That keeps the monetary risk per trade constant while the proportion of your account at stake shifts as the balance moves. Nothing in the configuration adjusts volume after a losing run or a winning one, which rules out both martingale behaviour and compounding. Traders wanting percentage-based risk would need to alter the input manually as their balance changes, or run a separate money management layer alongside.
Should I change the stop loss or take profit?
Only after testing, and only once you understand what moves with them. Widening a target improves reward to risk but lowers the strike rate, while tightening does the reverse; breakeven arithmetic shifts either way. The current combination requires roughly 46% of positions to succeed before costs. Any adjustment changes that requirement, so recalculate first and ask whether the new figure looks realistic for a system entering late by design. Test both variants rather than assuming.
Get a second opinion before you deploy it
If you are working through the ambiguous ATR and OsMA conditions above, or setting up a forward test and want the methodology checked, get in touch with Algo Trading Space. Working out what a strategy actually does before funding it is considerably cheaper than discovering it afterwards.
Risk disclaimer. Forex trading carries a substantial danger of loss and is not suitable for every investor. Nothing above constitutes financial advice, and the figures shown are arithmetic derived from published settings rather than indications of any outcome.


Comments
No comments yet. Be the first to comment!
Leave a Comment
Your email address will not be published. Required fields are marked with *