

A NASDAQ Expert Advisor is an automated trading program for MetaTrader that trades a broker instrument linked to the Nasdaq-100 index, usually listed as NAS100, US100 or USTEC. It does not buy shares of Nasdaq-listed companies; it opens and closes positions on the broker’s index product whenever its coded conditions are met.
This article explains exactly what such a program trades, then walks through a specific H1 strategy built by Petko Aleksandrov, founder of Algo Trading Space: a 4/8 SMA crossover entry, an exit based on Bill Williams’ Awesome Oscillator and fixed protective orders. You will see its historical backtest, how to interpret those figures honestly, and how to size, install and test it on MT4 or MT5.
What Is a NASDAQ Expert Advisor?
It is a fully automated expert advisor: a set of coded rules that monitors an NDX-linked instrument and executes trades without manual input. People also call it a NAS100 EA, a US100 trading robot or a NASDAQ trading bot; the label varies, but the mechanics stay identical. Sales pages often claim that sophisticated algorithms analyze real-time data, yet the strategy in this article is far simpler, reacting to two moving averages and one oscillator on completed bars.
It is also different from a stock-picking bot. A share-trading algorithm chooses which companies to buy, while this kind of EA takes a view on the whole index moving up or down, using a single margined instrument and closing positions within hours or days.

Automation brings two practical benefits on this market. The program watches every bar of a long session without fatigue, and it applies the same logic each time, so the strategy you backtest is the one placing trades. What it cannot do is decide whether those rules still suit current market conditions, which remains the trader’s job.
NASDAQ, Nasdaq-100 and NAS100: What’s the Difference?
These names describe different things, and confusing them leads to wrong expectations. Nasdaq describes its flagship index as tracking 100 of the largest non-financial companies on its exchange, using a modified market-capitalisation weighting that stops any single member from dominating, and contrasts it with the Composite’s more than 3,000 securities (Nasdaq, 2026; NDX methodology).
| Term | What it means |
| Nasdaq Stock Market | The exchange where companies list and their shares change hands |
| Nasdaq Composite | Benchmark covering essentially every company listed there |
| Nasdaq-100 (NDX) | Index of 100 large non-financial members of that exchange |
| NAS100, US100, USTEC | Typical broker names for CFDs tracking the NDX |
| NASDAQ EA | Informal name for an automated expert program that trades one of those CFDs |
So when your MetaTrader chart says NAS100, you are trading a broker’s derivative on the index level, with its own pricing, spread, session times and overnight financing. Two firms’ versions can behave slightly differently even though both follow the same underlying benchmark.
How the NASDAQ EA in This Article Works
This is an advisor designed as a short-term trend follower on the one-hour chart. It enters when a very fast moving average crosses a slightly slower one, exits on a momentum signal, a stop loss or a profit target, and spends most of its time flat. The full strategy setup is summarised below.
| Parameter | Setting in the original version |
| Instrument | Broker’s Nasdaq-100 CFD, shown as NASDAQ in the video |
| Timeframe | H1 |
| Fast average | 4-period SMA |
| Slow average | 8-period SMA |
| Long entry | 4 rises through 8 |
| Short entry | 4 falls through 8 |
| Exit indicator | Awesome Oscillator zero-line cross |
| Stop loss | 6,000 in the EA’s point input, about $60 of price movement on the tested feed |
| Take profit | 9,000 in the point input, roughly $90 on that feed |
| Testing model | Bar-open prices |
4/8 Moving Average Entry Rules
A long position opens at the start of the bar after the 4-period SMA crosses above the 8-period one, and a short opens after the reverse cross. Because both averages are so short, the rule reacts within a few hours of a turn, catching intraday swings that a slower pair would miss.
That speed cuts both ways. Our explainer on how moving average crossover EAs work explains why short pairs produce more signals, higher costs and more false crosses than longer ones.
Why Such a Fast Crossover?
Why use 4 and 8 rather than a familiar pair like 20 and 50? On an index that trends hard during the US session and then pauses, a very quick crossover can join a move early enough for a $90 target to be reachable within a day. The trade-off is sensitivity: the same pair reacts to every minor wobble, so the stop, target and exit rules do much of the work of separating real moves from noise.
A Buy and a Sell Example
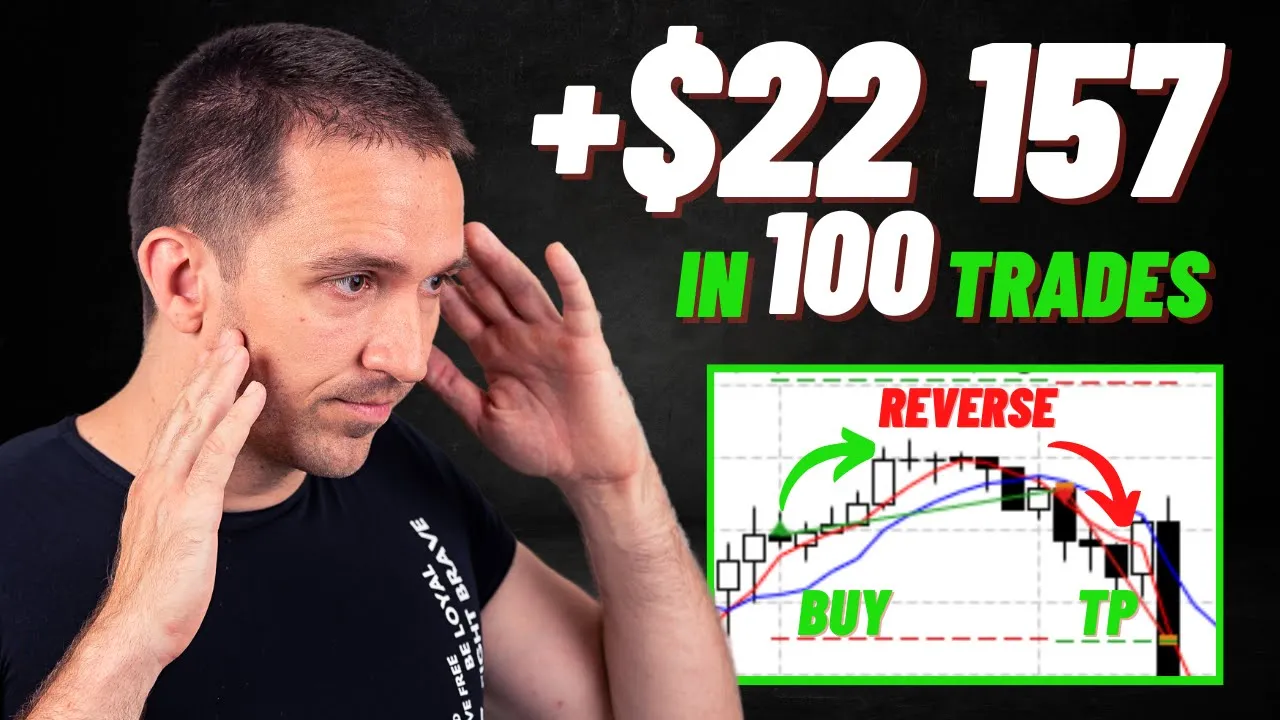
In the long trade shown in the video, the fast average climbs over the slow one, the EA buys at the next bar’s open, and price climbs until the take profit closes the trade. No oscillator exit is needed because the target arrives first.
A short works in mirror image. The quick line drops through the slower one, the EA sells at the following open, and the position closes at whichever comes first: the $90 target below entry, the $60 stop above it, or the Awesome Oscillator condition. Watching both directions in a visual backtest is the fastest way to confirm the EA behaves as described on your broker’s data.
How the Awesome Oscillator Exit Works
If neither the stop nor the target is hit, the EA closes a long when the Awesome Oscillator crosses zero upward, and a short on the mirror condition. MetaQuotes defines the indicator as the difference between 5-period and 34-period simple averages of the bar midpoint, (high + low) / 2 (MetaQuotes Awesome Oscillator reference).
This exit deserves scrutiny before you trust it. In Bill Williams’ own framework an upward zero cross is usually read as bullish momentum, so closing a long at that moment is counterintuitive: the rule effectively banks gains once momentum has already turned positive. Rules like this often emerge from strategy generators because they fitted past data well, which is a reason to check whether the exit still adds value when you retest.
Stop Loss and Take Profit: Points, Pips and Dollars
The original settings used 6,000 and 9,000 as point inputs, which on the broker used for testing equalled roughly $60 and $90 of index movement. Calling these “pips”, as the earlier version of this page did, is misleading, because index CFDs are quoted in points whose size depends on how many decimals your broker displays.
Before reproducing the settings, right-click the instrument in Market Watch, open its specification and check:
- the number of digits and the minimum price increment;
- the contract size, meaning what one lot represents;
- the cash value of a one-point move per lot;
- session hours and swap rates for positions held overnight.
With those figures you can convert the dollar distances into the right inputs for your feed instead of typing the original values blindly.
Historical Backtest Results
The video shows the EA tested over roughly the six to seven months before its April 2023 publication, on historical data exported from BlackBull Markets. The backtesting results below come from that recording and describe one past period only.
| Metric | EA Studio | MetaTrader 4 tester |
| Trades | 115 | 113 |
| Starting balance | $10,000 | $10,000 |
| Ending balance | About $32,157 | $32,348.98 |
| Net gain | About $22,157 | About $22,349 |
| Profit factor | n/a | 1.75 |
| Maximum drawdown | 19% | n/a |
| Longest losing streak | 4 | 4 |
| Longest winning streak | n/a | 5 |
| Time with an open trade | About 8 to 9% | n/a |
| Position size | 10 lots | 10 lots |
Source: figures read out in the embedded video (article first published 18 April 2023); n/a means the video did not show that value. Historical and hypothetical results do not indicate future performance.
How to Read These Results
Start with a correction. The original article described roughly $32,000 of profit, but that is the ending balance; with a $10,000 start, the net gain was about $22,000. Aleksandrov also mentioned that earlier comparisons found EA Studio and MetaTrader trades matching around 98 to 99% when data was exported properly, which is why the two columns sit so close.
The context matters more than the headline:
- The sample is short. Just over 100 trades across six or seven months meets Aleksandrov’s own minimum of 100, but it covers a single market regime.
- The position size is aggressive. Ten lots on $10,000 produced that drawdown in a favourable period; a less friendly stretch could cut far deeper.
- Profit factor alone is incomplete. A reading of 1.75 means winning trades outweighed losing ones by that ratio in this window, not that the edge will persist.
- Costs were firm-specific. The video quotes a $1.60 NASDAQ spread at BlackBull Markets, its sponsor, at the time of recording; yours may differ.
- Nothing here is out of sample. The rules were built and tested on the same months, so an unseen period is the next test worth running.
What a Stronger Test Would Include
If you retest the EA today, go further than the original video did. Run it on at least a year of recent H1 data from your own broker, reserve the latest few months as a period the parameters never saw, and compare results with and without realistic spread and swap costs. Re-running the test on a second broker’s feed is a cheap way to spot a strategy that only works on one data source. Finally, forward-test on demo long enough to see both trending and range-bound weeks. The video mentions trading on a real-money account, but no live signal or verified statement is shown, so the backtest is the only evidence available.
Disclosure: the video was sponsored by BlackBull Markets, and Algo Trading Space may earn a commission if you open an account through its affiliate link.
Historical testing shows how the rules behaved under the conditions included. It cannot establish that the EA will stay profitable, so weigh it alongside drawdown, trade count, costs and forward testing.
How to Choose Lot Size for NAS100 Automation
Trade volume should come from the amount you are prepared to lose per trade, not from the backtest, and this calculation is the core of risk management for any index EA. The 10-lot figure was a test configuration, and copying it without checking your contract size could expose you to losses many times larger than intended.
A risk-based process:
- Decide the maximum you accept losing on one trade, often a small percentage of equity.
- Find this strategy’s stop distance in points on your feed, equivalent to about $60 of movement.
- Look up what one point is worth per lot in the specification.
- Divide your risk amount by stop distance multiplied by per-lot value, then round down to an allowed volume.
- Confirm the margin requirement leaves room for adverse moves.
A purely hypothetical illustration: if each index point equals $1 per lot on your feed, you choose to risk $100 on a trade, and the stop sits 60 points away, the calculation is 100 ÷ (60 × 1), or about 1.66 lots, rounded down to 1.6. The actual point value on your account will almost certainly differ, which is exactly why the specification check comes first.
Leverage limits apply too. Under ESMA’s product intervention measures, retail CFD leverage on major equity indices is capped at 20:1 in the EU (CNMV summary of ESMA measures, June 2018), and higher gearing offered elsewhere magnifies losses exactly as fast as gains.
How to Backtest the EA in MT4
Testing on your own broker’s history is the only way to see how the logic behaves on the feed you will actually trade. The MT4 workflow shown in the video runs as follows:
- Open your broker’s NAS100 symbol in a new chart and switch it to H1.
- Choose File > Open Data Folder, go to MQL4 > Experts and paste the EA.
- Double-click it to open MetaEditor, then press Compile, leaving the code untouched unless you are a developer.
- Drag the EA from the Navigator onto the chart and complete the bot configuration by setting lot size and magic number in the inputs.
- Launch the Strategy Tester, pick the “Open prices only” model and press Start.
- Review Results, Graph and Report for trade count, drawdown and profit factor.
MetaQuotes notes that this model uses only each bar’s opening price (MetaQuotes testing documentation), which suits an EA that acts only at a new bar. The magic number lets the terminal separate this EA’s positions from others on one account; our explainer on what a magic number does in an Expert Advisor covers it, and our step-by-step MT4 backtesting walkthrough goes deeper on data quality and spread settings.
NASDAQ EA on MT4 vs MT5
The original download was an MT4 file, and it will not run on MT5 as it stands. MT4 robots are written in MQL4 and compile to .ex4; MT5 versions use MQL5 and, per MetaQuotes, compile to .ex5 files stored in MQL5/Experts (MetaTrader 5 Help, Algorithmic Trading).
Running this strategy on MT5 therefore means rebuilding the logic in MQL5 or re-exporting it from a builder that supports both platforms. The newer tester then adds real-tick modelling and multi-threaded optimisation, which our tutorial on backtesting in MetaTrader 5 walks through.
NAS100, US100 and Broker Symbol Differences
Can’t find “NASDAQ” in your terminal? Your broker almost certainly lists it under another name, such as US100, USTEC, NAS100, NDX100 or a custom label with a suffix like “.cash”. Some firms list two versions, one priced from the cash index and another from futures with an expiry date; an EA tested on one will not necessarily match the other. Right-click Market Watch and choose Symbols to search the full list.
Beyond the name, check three differences as part of your bot setup:
- Precision: one firm may quote to one decimal place and another to two, changing what the point settings mean.
- Session times: CFD providers set their own hours and daily breaks, which affects when H1 bars form.
- Costs: spread, commission and swap all vary, and a strategy with a small edge per trade is sensitive to each.
When the Strategy Produces False Signals
The fast crossover reacts quickly, which means it also picks up noise. In sideways sessions the two averages can cross several times a day, opening positions that reverse before reaching either the target or a meaningful exit.
Weak conditions on this instrument typically include the quiet hours before the US cash open, holiday sessions and the choppy trading that often surrounds scheduled data releases. Traders adapting this trading strategy sometimes test a higher-timeframe trend filter, a volatility threshold or a trading-hours window to skip those periods. Any addition should be tested out of sample, because each extra rule added to a trading system is another chance to fit the past.
What to Look for When Comparing NASDAQ EAs
Whether you use this EA or compare other automated strategies, the risk controls matter more than the entry rule. Features worth checking include:
- A stop on every trade, fixed or volatility-based.
- Position sizing by risk percentage rather than fixed lots only.
- A maximum spread filter to skip entries when costs spike.
- Volatility and session filters to avoid thin or chaotic periods.
- Daily loss and concurrent-trade caps to limit exposure.
- Break-even and trailing options for managing open positions.
- News handling, meaning either a pause around major releases or an explicit acceptance of that risk.
The EA in this article has a fixed stop and target plus an oscillator exit; it lacks several items above, so treat the list as an evaluation checklist rather than a description of it.
Advantages and Limits of Automated Index Trading
The main advantage is disciplined execution. An automated strategy:
- follows its rules without panic during sell-offs or hesitation after losses;
- monitors sessions no person could watch continuously;
- places every order exactly as backtested, making results reviews meaningful.
That discipline has limits. Because the index is concentrated in large technology and growth companies, a single heavyweight earnings report can move the whole benchmark sharply outside regular hours. Price also reacts to Federal Reserve decisions, inflation and employment data, and geopolitical shocks, and those events can widen spreads, cause slippage and jump beyond a stop. Aleksandrov made a related point in the video: robots do not “stop working”; markets change, and parameters that fitted one period can stop fitting the next, which is why he retests and updates his EAs regularly.
Getting the EA and Demo Testing It
The free download linked from the 2023 recording no longer works. In September 2025, Algo Trading Space retired the free EAs shared in older videos because they needed re-optimisation, and now offers three monthly-refreshed EAs in the Freebies tab of a free platform account. To rebuild or update these rules yourself, EA Studio can generate and export them for either platform.
Whichever version of the trading robot you use, run it on a demo account with your broker’s real spreads before committing capital. This confirms the EA executes as intended; it does not prove future profitability, because real trading adds slippage and changing conditions.
FAQs
Can this EA trade other indices like the Dow Jones or S&P 500?
It can be attached to them, but the settings were built for NDX behaviour and should not be assumed to transfer. The Dow and the S&P move with different volatility and sector exposure, so stop distances, averages and the oscillator exit would all need retesting on each benchmark separately. Treat every new instrument as a separate strategy. Our article on Dow Jones algorithmic trading shows how strategies for that index are filtered and validated.
Do overnight swap charges affect NAS100 automation?
Yes, whenever positions stay open past the broker’s daily rollover. Index CFDs usually carry a financing charge or credit for each night a position is held, set by the provider and sometimes tripled on one weekday to cover the weekend. This strategy spends little time in the market, so swaps matter less than for a swing strategy, but they still belong in any backtest. Check the swap rates in the NAS100 specification before assuming historical results apply to your account.
Can I trade the Nasdaq-100 with futures or ETFs instead of CFDs?
Yes, although that usually means leaving the MetaTrader CFD route. Futures on the index trade on regulated exchanges with standardised contract sizes, and exchange-traded funds tracking the benchmark can be bought through a share-dealing account. Some firms offer futures inside MetaTrader 5, but many retail accounts only provide index CFDs. Each route has different costs, margin rules and tax treatment, so the same EA logic would need adapting and retesting first on whichever instrument you choose.
Can prop firm accounts run this EA?
Sometimes, but every funded-trading firm writes its own rules. Many allow Expert Advisors yet restrict certain styles, cap daily and overall losses, or limit trading around major news, and some list index CFDs under different names or with wider spreads. A strategy that tolerated a 19% drawdown in testing could breach a typical challenge limit quickly at the original position size. Read the EA policy and backtest against its loss limits before paying any challenge fee.
Can I run the same strategy on TradingView?
The logic can be reproduced there, as Aleksandrov noted in the video. On TradingView you would add two simple moving averages with periods of four and eight plus the Awesome Oscillator, both built into the platform, then code the entry, exit and protective levels in Pine Script or use alerts connected to a broker. Execution, data feed and costs will differ from MetaTrader, so results will not match the original backtest exactly, and any TradingView version needs its own testing first.
How often should the strategy be re-optimised?
There is no fixed schedule, but a fast index strategy usually needs checking more often than a slow one. Many traders review results monthly and re-run backtests on recent data whenever live results drift noticeably from historical expectations. Re-optimising too often risks chasing noise, so compare updated parameters on out-of-sample data before switching. Aleksandrov’s own practice, described in the video, was to retest regularly and update parameters when conditions changed sharply, rather than on a fixed calendar.
Get Help Testing Your NAS100 EA With Algo Trading Space
If you want help converting these NAS100 settings to your broker’s contract specification, or a second opinion on your backtest before going live, get in touch with the Algo Trading Space team. We can help you set up a fair test on your own data before any capital is at risk.
Risk warning: Trading CFDs on indices carries a high risk of loss, and leverage can magnify losses beyond your initial deposit. This article is for educational purposes only and is not financial advice. Backtest results are hypothetical and do not guarantee future performance.


Comments
No comments yet. Be the first to comment!
Leave a Comment
Your email address will not be published. Required fields are marked with *